
Identify improvement opportunities per department and care pathway.
The Cockpit is built on your annual data and helps you establish a baseline. It includes your internal KPIs, compares them to anonymised peers, and highlights the areas with the biggest improvement potential.
Monitor performance across key financial and operational KPIs.
Benchmark costs, revenues, activities, and FTEs by department and pathology (DRG & SOI).
Get data-driven recommendations on where to focus your efforts.
.avif)
We help keep hospitals running smoothly, so they can provide the best care possible


Follow up on the actions proposed in the Cockpit with our insights modules.
Get monthly insights into your day-to-day operations with our insights modules.
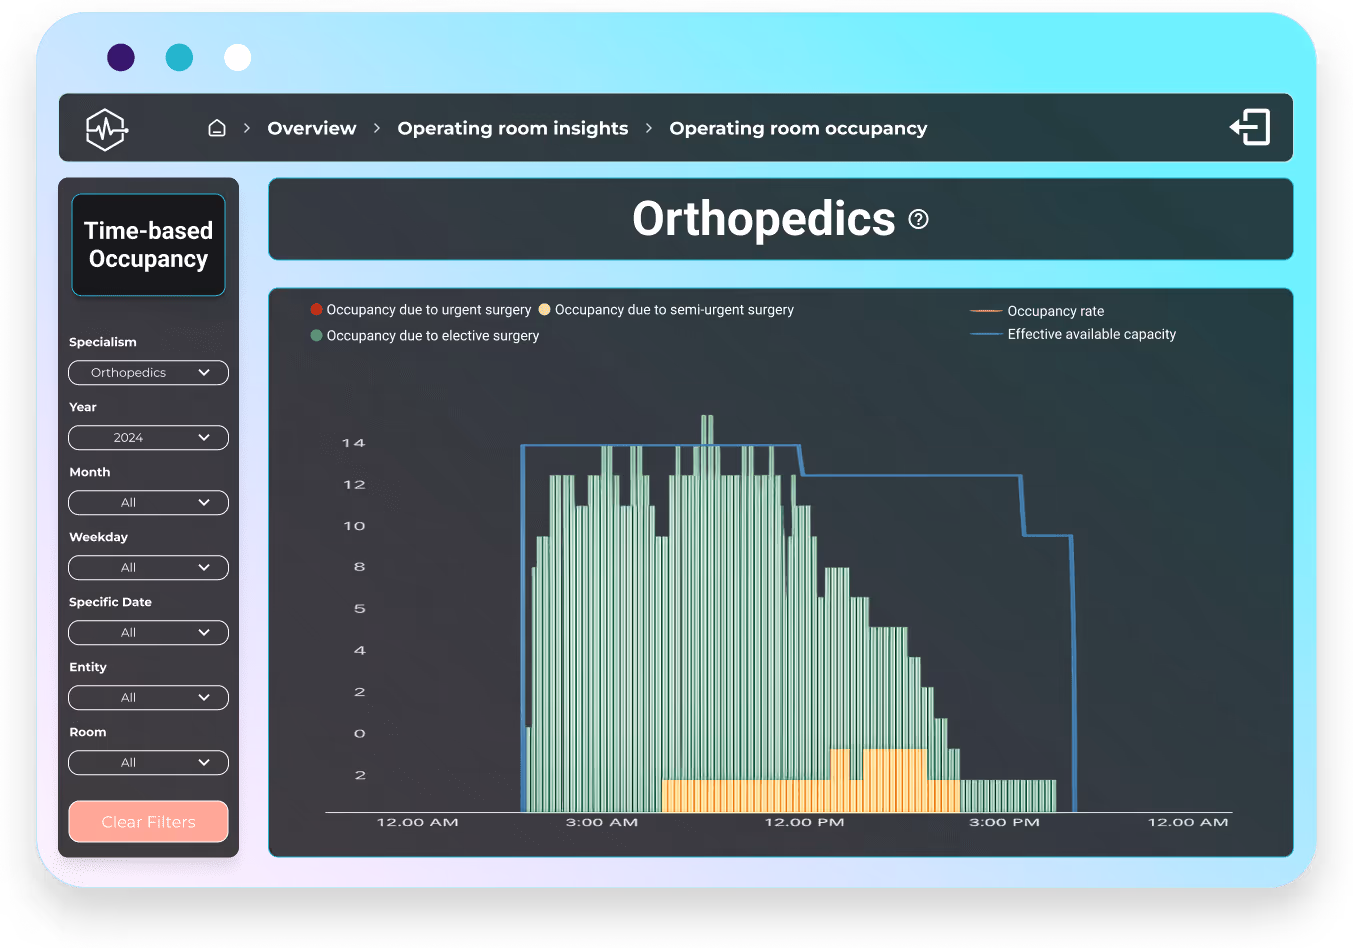
Maximize OR utilization with targeted, monthly data.
Track how surgical capacity is used across specialisms, pinpoint where time is lost, and identify clear opportunities for optimization.
Understand how each department uses available OR time.
Identify causes like late starts, turnovers, early finishes, and unused blocks.
Compare performance with peers and monitor progress over time.
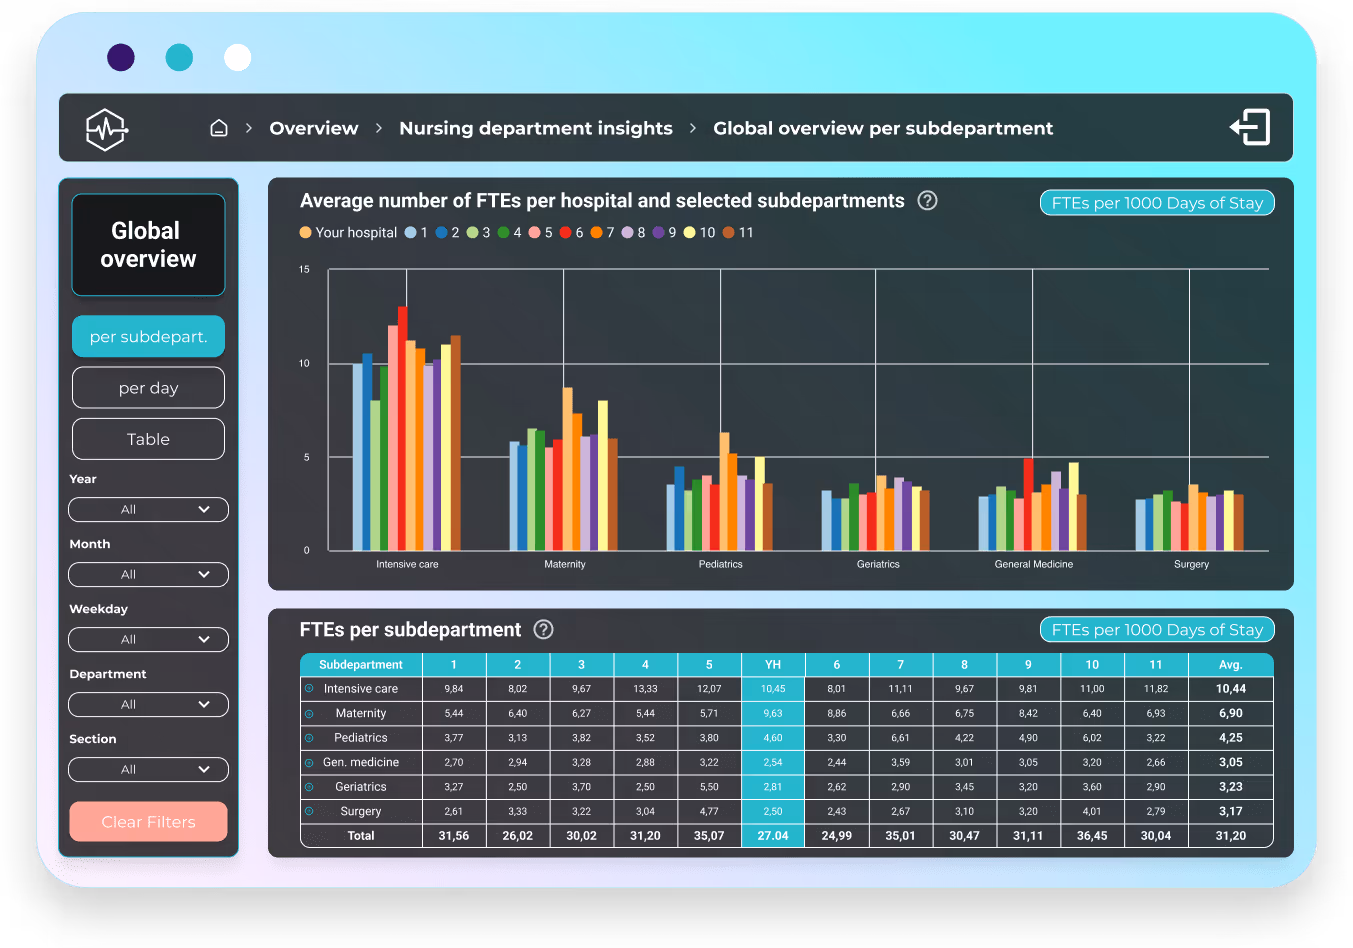
Bring nursing data to life to improve care delivery.
Gain real-time insight into capacity, staffing, patient experience, and care quality across nursing units and day hospitals.
Analyze bed occupancy and patient flow for smarter capacity planning.
Match nursing effort (FTE) to actual care demand.
Track satisfaction, adverse events, and outcomes across nursing units.
Gain clinical control with insight into outcomes, costs and practice variation
This module helps clinicians and medical leadership steer based on data. It reveals where variation exists, what it costs, and how care outcomes compare.
Understand financial results and billing details per treatment or patient type.
Identify outliers in Length of Stay and surgical times by DRG and SOI.
Track quality indicators and measure against peer hospitals.
.avif)
.avif)
Gain clarity on drug and implant use, cost coverage, and prescribing variation
Pharmacy Insights helps you manage margins and prescribing behavior with detailed analysis per pathology, physician, and product category.
Measure margins and assess if flat fees cover actual costs per pathology.
Identify variation in usage and cost between prescribers.
Compare with other hospitals and drill down to ATC level 4.
.avif)
.avif)
.avif)
Insights for healthcare management
Stay informed with our latest insights and resources.


Subscribe to our News4Health letter
No spam, only content and insights to help you run your hospital optimally.